Consumption is no longer the defining feature of the US economy: how AI capital expenditure has become the ‘backbone’ of US GDP

Automatically translated. Read the Chinese original.
Introduction: For a long time, global investors have held a deeply ingrained consensus regarding the US economy: ‘Consumption is life; without it, the economy dies’. Personal consumption expenditure (PCE) accounts for nearly 70 per cent of US GDP; as long as ordinary Americans continue to use their credit cards, the economic engine will not stall. However, the latest macroeconomic data released in 2026 paints a new reality that completely overturns this conventional wisdom:Consumer spending has taken a back seat; instead, the US economy is now underpinned by the proliferation of AI data centres, expensive GPU clusters and extensive power grids. Wall Street estimates suggest that nearly half of US economic growth this year has been driven directly by AI capital expenditure (Capex); under the most aggressive projections, this figure has even been estimated at a staggering 74 per cent. Exactly how many percentage points has AI investment contributed to growth? What would happen to the US economy if this colossal computing-power money-spinner were to suddenly grind to a halt? Are we reliving the old dream of the 1990s ‘trillion-fibre’ Great Leap Forward?
Prologue: The Emergence of a Single-Engine Economy
Let us first turn our attention to several sets of macroeconomic data officially finalised this year by the US Bureau of Economic Analysis (BEA):
- The fourth quarter of 2025: The annualised quarter-on-quarter growth rate of US real GDP was only a meagre +0.5%, almost slipping to the brink of stagnation;
- First quarter of 2026: GDP growth suddenly rebounded strongly to +2.1%(Third estimate revised to +2.5 per cent);
- The second quarter of 2026: The final GDP figure remains stable at +2.2% the moderate range.
Figure 1Schematic illustration of AI capital expenditure (trading terminals and data centre server rooms): AI capital expenditure has evolved from an isolated commercial activity undertaken by tech giants into the primary driver of US macroeconomic growth. (Image source: TFTC / Ghost CDN)
On the surface, this appears to be a standard report card on the US economy’s ‘soft landing’. Yet behind the spotlight, the structural pillars have undergone a historic fracture and reorganisation:
The contribution to economic growth from household consumption—which had previously been the dominant driver—has been significantly squeezed, whilst investment in residential property has acted as a drag on growth for several consecutive quarters due to high mortgage interest rates of 7.5 per cent.The only driving force that will prevent the US economy from plunging into recession in 2026 is the AI infrastructure development on which the tech giants are betting heavily, regardless of the cost.
As Bridgewater asserted in its macroeconomic research report:The US economy is becoming a giant ship powered by a single engine—and that sole pillar of support is known as AI capital expenditure.
1. The ‘74 per cent’ controversy: How many percentage points has AI actually contributed to the US economy?
In the debate between the financial community and macroeconomists, ‘Just how much has AI actually contributed to GDP growth?’ is currently the most contentious and revealing topic. The conclusions circulating in the market range from 30% to 74% or even higher, depending on the circumstances.
How on earth did this vast range of figures come about? We must break it down into four distinctly different statistical methodologies:
Scenario 1: TFTC’s ‘74 per cent’ – the broadest scenario (radical projection)
This summer, the renowned macroeconomic analysis organisation TFTC calculated, based on the Bureau of Economic Analysis’ (BEA) National Income and Product Accounts for the first quarter of 2026 (NIPA Table 1.5.2), that:Investment in AI data centre construction and software accounted for nearly 74 per cent of US GDP growth in the first quarter.
The algorithm is extremely straightforward and crude:
In the first quarter, the annualised contribution to US real GDP growth was 2.1 percentage points. TFTC directly extracted two major sub-categories from fixed asset investment—Information processing equipment(including data centre servers, network hardware and GPU clusters) contributed approximately 0.65 percentage points, plusIntellectual Property Products(primarily in AI training and enterprise-level software development) contributed approximately 0.90 percentage points, with the two combined totalling 1.55 percentage points。
1.55% ÷ 2.10% ≈ 73.8% ≈ 74%
- Reasonableness: The St. Louis Fed also used the same sub-components as proxy variables for tracking AI in a special report published in January this year; this methodology has precedents at central bank level;
- Weak points: These two broad categories fall under the ‘broad IT basket’ and inevitably include traditional non-AI software and standard office equipment procurement; they represent the broadest possible upper limit in analysts’ projections.
Measure 2: The Federal Reserve’s (Fed) rigorous net contribution measure (30 per cent–50 per cent)
On 17 July 2026, the Federal Reserve Board published a landmark research note entitled ‘AI Development and the Macroeconomy’ (The AI Buildout and the Economy). Economists at the Federal Reserve have developed a more sophisticated proxy model: one that tracks four major sub-sectors simultaneously—software, data centre construction, electricity infrastructure and computing equipment—butIt specifically excluded the negative impact of the sharp rise in imported components on net exports.。

Figure 2The quarterly contribution of the Federal Reserve’s AI investment agent index (software + data centre construction + electricity infrastructure + IT computing equipment) to real GDP. The net effect (black line) shows a significant contribution, but this is subject to considerable volatility due to drag from net exports, such as server imports. (Data and chart: Federal Reserve Board / BEA, FEDS Notes 17 July 2026)
The conclusion reached by the Federal Reserve is highly enlightening:
The boost from gross investment in AI development has indeed been exceptionally strong; however, as a large proportion of server components rely on overseas supply chains, the surge in imports has, in some quarters, directly offset half of the total investment contribution. After adjusting for import leakage,The actual contribution of net investment in AI to US GDP growth falls within the range of approximately 30 per cent to 50 per cent。
More importantly, the Federal Reserve was quite forthright in its report:“As of 2026, no widespread signs of technological transformation have yet been observed in aggregate macroeconomic productivity data.” In other words, current GDP is purely the result of massive investment in ‘infrastructure construction’ using real money; the cost-saving and efficiency-boosting benefits of AI technology itself are still far from being realised at the macro level.
Source 3: Bridgewater’s 1.4 percentage point median (approximately 50 per cent)
Greg Jensen, Chief Investment Officer at Bridgewater, and others have calculated that:AI capital expenditure directly contributed to approximately 1.4 percentage points of US GDP growth in 2026; this accounted for a full half (50 per cent) of the projected annual growth of 2.8 per cent. They forecast that by 2027, this boost will have increased further to 1.5 percentage points. This level is now fully on a par with the intensity of business investment seen during the internet boom of the 1990s.
Perspective 4: Goldman Sachs’ global trillion-dollar outlook
Joseph Briggs, a macroeconomist at Goldman Sachs, has calculated this based on the total money supply:In 2026, total global investment in AI-related sectors is set to officially exceed US$1 trillion (>$1T), with the United States alone accounting for US$581 billion ($581B) of this figure.
| Statistical and Analytical Criteria | Calculated contribution percentage / amount | Core Methodology and Features | Key Limitations and Notes |
|---|---|---|---|
| TFTC Aggressive Upper Limit Calibre | ~74%(Q1 2026) | NIPA Table 1.5.2: Direct sum of the ‘software’ and ‘hardware’ sub-items (contributing 1.55 percentage points / 2.1 per cent) | Includes non-AI traditional IT and software procurement; the scope is rather broad |
| Federal Reserve (Fed) – strict net basis | 30% – 50%(Dynamic fluctuations) | Based on a comprehensive analysis of four categories of factors, the negative impact of import leakage in servers and components on net exports has been excluded. | The net effect is subject to significant quarterly fluctuations due to the trade deficit, indicating that productivity gains have yet to materialise |
| Bridgewater Headquarters | ~50%(Contributing approximately 1.4 percentage points over the year) | This includes profit distribution by chip giants and combined investment in software and hardware, which is expected to account for half of the full-year growth. | The most widely cited benchmark in the market forecasts a figure of 1.5 percentage points by 2027 |
| Goldman Sachs’ Macro Perspective | United States $581B(Global > $1T) | Global Top-Down Capital Expenditure Statistics | Measuring the total stock of funds, rather than the marginal change in GDP for a single quarter |
An objective conclusion for the general reader:
As for the question ‘Exactly how many percentage points has AI contributed?’, the honest answer is oneInterval—Even using the Federal Reserve’s most conservative net measure, AI is driving between 30 per cent and 50 per cent of economic growth across the United States; according to the widely cited central estimate,This year, one in every two dollars of growth in the US is attributable to AI capital expenditure。
In peacetime—when there is no war and the government is not actively pursuing a massive 4 trillion infrastructure programme—the private sector’s capital expenditure in a single industry alone accounts for nearly half of a major economy’s growth; this is an extremely rare occurrence in modern economic history.
II. The Microfoundations of the Trillion-Yuan Infrastructure Programme: From the Five Giants to the 100-Billion-Yuan Computing Power Chain
This colossal macro-level load-bearing pillar has been built, at the micro-level, by a succession of technology giants through a series of irrevocable, binding contracts.

Figure 3Trends in quarterly capital expenditure among major tech giants (hyperscalers): from approximately US$3 billion to US$5 billion per quarter in 2019, soaring to the epic scale of tens of billions of US dollars per quarter per company today. (Data: SEC 10-Q filings / Federal Reserve Board)
1. The spending arms race amongst the five tech giants
According to the latest financial results and guidance disclosed by major technology companies:
- Microsoft: The capital expenditure guidance for the 2026 calendar year has been raised directly to Approximately US$190 billion ($190B), a staggering 61 per cent year-on-year increase, with expenditure by a single company exceeding market expectations by US$35 billion;
- Amazon: Annualised capital expenditure is also surging towards Approximately US$200 billion ($200B) High;
- Statistics show that the total capital expenditure of the world’s five largest cloud giants, including Alphabet (Google) and Meta, for the year 2026 alone will amount to US$700 billion to US$725 billion ($700B–$725B) astronomical range.
Leading think tank A specialised study published by Epoch AI Further evidence of this dramatic change:At present, AI-related capital formation alone (data centre construction and hardware equipment) accounts for approximately 0.8 per cent of US GDP, driving the share of the entire computing infrastructure in GDP up to 1.5 per cent.— Compared with the historical average of just 0.7 per cent between 2015 and 2022, this represents a staggering ‘doubling surge’.
2. A follow-up to the previous instalment: The chain of computational debt among micro-entities
The microscopic foundation of this macro-level pillar is precisely those two cutting-edge large-model unicorns that we dissected in our previous two in-depth analyses:
- Anthropic: The draft prospectus reveals that the company is burdened with debt spanning approximately 10 years and amounting to as much as US$518 billion ($518B) firm commitments to purchase computing power, of which nearly 80 per cent (US$413.7 billion) are fully irrevocable, binding contracts;
- OpenAI: In 2025 alone, expenditure on cloud computing power for Microsoft Azure is set to reach as much as US$17.2 billion, whilst the total budget for the long-term computing infrastructure plan up to 2030 is a staggering US$856 billion ($856B)… and have even joined forces to spearhead the US$500 billion ‘Stargate’ supercomputing project.
The total long-term computing power debt committed by the two companies alone has already surpassed the total annual investment in AI across the United States. This closed loop—where ‘buyers sign massive, irrevocable commitments ➔ cloud service providers frantically snap up land to build data centres ➔ chip manufacturers ramp up production to full capacity’—has directly endowed this capital expenditure with an extremely strong, unstoppable momentum: the arrow is on the string; no one can stop it now.
III. Counterfactual analysis: What would happen if AI capital expenditure were to come to a halt?
The simplest way to assess just how important a column is, is to carry out aCounterfactual Analysis: Assuming that the major players stop stepping up their investments tomorrow, and this pillar is removed or scaled back, what would happen to the US economy?
Based on the verified data model, we can clearly deduce three levels of mechanical impact:
| Impact Levels | Assumptions | Transmission mechanisms and economic consequences |
|---|---|---|
| Impact 1: Slowdown in growth | Zero growth in capital expenditure (capex) or a 20 per cent contraction in the existing stock | The 1.4pp increase projected by Bridgewater has effectively evaporated; nearly half of the US’s GDP growth for the quarter has been wiped out, and should it contract by 20 per cent, it would fall by more than 1 percentage point, bringing the economy to the brink of recession; the +0.5 per cent figure for Q4 2025 represents the true underlying trend once the impact of AI is factored out. |
| Impact 2: Employment and Regional Shock | The investment slowdown is being felt across the real economy’s industrial chain | Data centres are, by their very nature, a heavy industry: electrical installation, specialist electricians and heavy-duty HVAC systems are all under significant strain; the impact is concentrated in ‘computing corridors’ such as Northern Virginia, Texas and Arizona, where the retreat of capital-intensive industries has given rise to political pressure on local finances and employment. |
| Impact 3: The ratchet effect in factor prices | Even if spending returns to normal | The electricity grid connection quotas, industrial land and water prices—which were fiercely contested in the early stages—exhibit extremely high stickiness; the utility bills for households and the manufacturing sector, which have been driven up, are unlikely to fall rapidly; “stalling growth coupled with soaring costs” is leading to a slide into the quagmire of stagflation. |
The impact is transmitted from top to bottom in three stages: the first stage is immediate (data for the current quarter); the second stage is delayed by 2–4 quarters (the project construction cycle); and the third stage is the most enduring (the ratchet effect of factor prices).
Growth halved in an instant:
AI capital expenditure contributed 1.4 percentage points to the full-year growth rate.If AI capital expenditure were merely to ‘stop growing’ (with the growth rate falling to zero whilst absolute investment levels remained unchanged), the US GDP growth rate for that quarter would be wiped out by nearly half.; If tech giants were to cut their overall budgets by 20 per cent due to pressure on profits, US real GDP would contract by more than one percentage point, instantly pushing the economy to the brink of recession. That +0.5 per cent figure for the fourth quarter of 2025 – which narrowly avoided turning negative – represents the true underlying decline in the US real economy once the AI frenzy is factored out.Heavy Industry and the Local Economic Shock:
Contrary to the widespread belief that ‘AI is merely a virtual economy that writes code’, today’s data centres are, in essence, aA Celebration of Heavy Industry and Civil Engineering. The procurement of high-voltage substations, industrial chillers and standby diesel generator sets has sustained a large number of mid-to-high-end manufacturing and specialist construction teams across the United States. Should investment dry up, key hubs such as Northern Virginia’s ‘Data Centre Corridor’ would immediately face a wave of stalled projects and mass redundancies in the construction sector.The ‘ratchet effect’ of factor costs:
Austan Goolsbee, President of the Chicago Federal Reserve, recently issued an extremely sobering warning:Data centres are encroaching on the electricity, land and water resources essential to ordinary households and the manufacturing sector in every conceivable way. Even if tech giants were to suddenly cut back on spending in the future, the inflated peak-hour electricity prices, grid modernisation surcharges and industrial land rents are highly inelastic and would not fall in tandem. The real economy would be forced to bear the bitter consequences of rising input costs for the long term, without reaping the benefits of an AI boom.
IV. Echoes of History: A Fateful Comparison with the ‘Great Leap Forward’ in Telecommunications Fibre Optics in the 1990s
Today’s AI frenzy is not the first time humanity has staked the macro-level fate of a nation on a high-stakes gamble involving communications and computing infrastructure. Thirty years ago, a similar scenario played out in an almost identical manner amidst the telecommunications and internet boom.
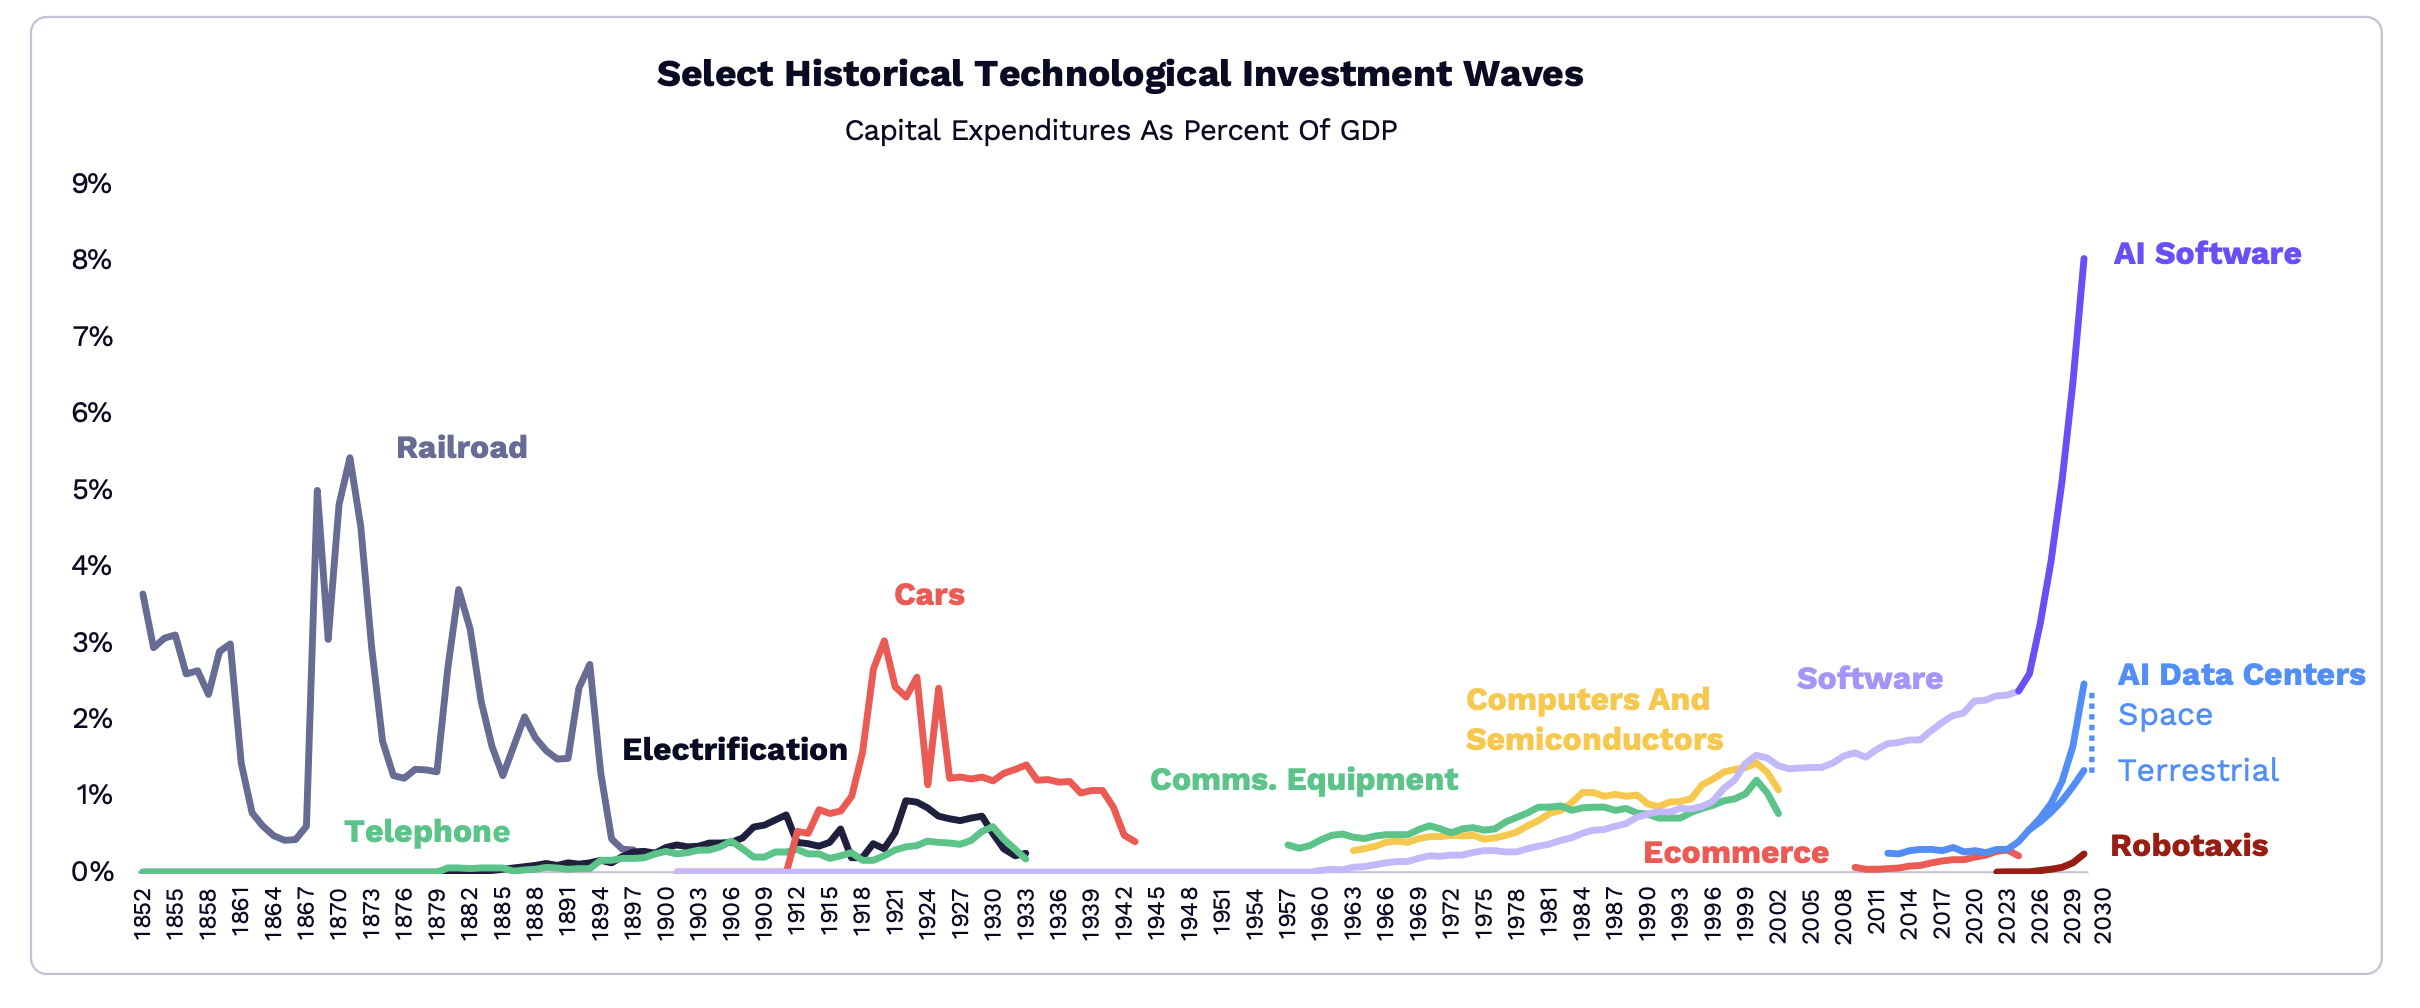
Figure 4Historical comparison of capital expenditure on cutting-edge technology as a proportion of GDP: the current rate of growth in AI capital expenditure has surpassed that of the US railway construction cycle in 1873. (Source: ARK Invest via Fortune)
1. 1996–2001: The Sensational Story of the Fibre-Optic Bubble
In the mid-to-late 1990s, under the banner of the ‘Information Superhighway’:
- Global telecoms operators and fibre-optic giants have collectively blown through Approximately 2 trillion US dollars ($2T) With its vast capital, it has laid more than 85 million miles advanced fibre-optic cables;
- The proportion of telecoms capital expenditure to GDP in the US peaked at 1.0 per cent to 1.2 per cent… which fuelled the economic boom of the latter part of the Clinton era.
However, when commercial demand failed to keep pace with the frenetic supply of technology, a brutal downturn ensued:
- In 2002, what was then the largest case of financial fraud and bankruptcy in US history—WorldCom’s spectacular collapse… as giants such as Global Crossing collapsed one after another, the telecoms sector saw nearly US$2 trillion wiped off its market capitalisation;
- Exactly four years after the bubble burst, a survey revealed that of the fibre-optic cables laid across the United States that year,As many as 85 per cent to 95 per cent have never been activated or used, and have become ‘dark fibre’ lying dormant underground.。
But the most ironic twist in history is this:
It was precisely this vast network of dark fibre—abandoned by bankrupt companies and virtually a free find—that provided an extremely cheap and ahead-of-its-time physical foundation for the rise, after 2005, of high-definition video streaming services (YouTube, Netflix), the mobile internet via smartphones, and the first generation of modern cloud computing services (AWS).The pioneers bled and went bankrupt, ultimately paving the way for the subsequent boom in innovation.
2. Similarities and differences this time round: why is AI more fragile than fibre optics?
| Dimensions of comparison | The Great Leap Forward in Telecommunications Fibre Optics in the 1990s | Major Expansion of AI Data Centres in the 2020s | Potential Risks and Differences in Mechanisms |
|---|---|---|---|
| Peak as a percentage of GDP | Approx. 1.0% – 1.2% | The current total is 1.4% – 1.5% | Both are part of a ‘super technology cycle’ that is reshaping the national macro-investment structure. |
| Authenticity of underlying technology | It’s true: the internet has completely transformed the world. | Indeed, large language models are becoming a new form of productive capacity. | Technology itself is not a scam; rather, it is the pace at which capital is being drawn down prematurely that is excessive. |
| Equipment manufacturer’s cycle amplifier | Nortel, Lucent | Nvidia, Broadcom | Equipment suppliers, acting as monopolists, reap the largest profits in the entire industry, thereby amplifying the capital-chasing effect |
| Physical depreciation attributes of assets | Extremely durable: As glass fibre buried underground is not subject to wear and tear, maintenance costs are virtually zero; we are waiting for demand to catch up. | Rapid depreciation:The depreciation cycle for GPU chips is only 3 to 5 years, As the next-generation computing architecture evolves rapidly, hardware that has backed the wrong horse will face obsolescence and be phased out. | ⚠️ The balance sheets of this round of AI infrastructure are far more vulnerable than those of fibre-optic networks |
| Financing Structure Models | Telecom operators increased their leverage through large-scale corporate bond issues (which ultimately led to a collapse as they were forced to roll over their debt). | In the early stages, it was underpinned by the tech giants’ abundant operating cash flow and cloud profits | Rapid ‘debtification’ is underway: Anthropic and OpenAI are accumulating computing power liabilities running into tens of billions or even hundreds of billions |
| Macroeconomic Monetary Environment | In the latter stages of the bubble, Federal Reserve Chairman Greenspan had ampleRoom for interest rate cuts | The Federal Reserve is mired in the battle against inflation(With the base rate remaining high at 3.75 per cent–4.00 per cent, and expectations of further rate rises still present) | External financing costs are extremely high, and there is no low-interest safety net to rescue the market |
The most crucial difference lies precisely inDepreciation period:
Even though it took eight years for Netflix to arrive on the fibre-optic cables laid underground all those years ago, the cables remained in perfect condition; but today, the millions of state-of-the-art GPUs piled up in data centres,Within three years, depreciation costs will be whizzing past on the profit and loss account, and within five years, the next generation of manufacturing processes will ruthlessly render them obsolete in terms of computing power-to-energy efficiency ratio.. AI Capital does not have the luxury of patience to wait a full decade for demand to develop naturally.
V. The Physical Ceiling and the Macroeconomic Closed Loop: The Thirst for Electricity is Driving Up Inflation
If the slow pace of commercialisation in the software sector is a hidden concern from a business perspective, then the most brutal challenge currently facing AI capital expenditure is a series of ruthlessUpper limits in physics and engineering。
1. A 33-gigawatt grid bottleneck and transformer delivery schedules spanning nearly three years
In an in-depth special report published in October 2026, Morgan Stanley calculated a set of figures regarding the skills gap that left Silicon Valley engineers breathless:
- It is estimated that by 2028, the additional electricity demand from data centres across the US will reach as high as 97 GW (gigawatts);
- Even if all the accelerated schemes for on-site power generation (industrial gas turbines, solid oxide fuel cells, and even attempts to restart small nuclear reactors) were taken fully into account, the US power grid could, at best, barely muster an additional 24 GW;
- Data centres across the US face an insurmountable net power shortfall of between 32 and 33 GW (equivalent to 34 per cent of total demand being at risk of power cuts).。
Accompanying the power shortfall is a supply disruption and severe congestion in the global heavy electrical equipment supply chain:
According to an authoritative industry survey by Wood Mackenzie, the current cost of purchasing a unit in North America isThe standard delivery lead time for large power transformers (LPTs) is as long as 128 weeks (nearly 2.5 years), whilst the generator step-up transformer is as long as 144 weeks (nearly 3 years)! Whereas in 2020, this lead time was just 6 to 12 weeks.
Gartner’s research further predicts that, within the next year, there will be 40 per cent of new AI data centres are directly affected by the suspension of electricity supply quotas… as many as half of the planning projects are facing substantial delays.
2. The Federal Reserve’s closed-loop warning: ‘AI is driving up inflation’
This scramble for physical resources is not only curbing the expansion of technology companies, but has also come directly to the attention of the Federal Reserve:
In the minutes of the Federal Reserve’s September FOMC meeting, a single line was formally included in the record of the entire Monetary Policy Committee:
“Geopolitical developments and the surge in AI-related investment are jointly driving up inflationary pressures (AI-related investments were pushing up inflationary pressures).”
Public statements by Federal Reserve officials no longer conceal their concerns:
- Beth Hammack, President of the Cleveland Federal Reserve Bank, pointed out that, in order to secure access to the grid, tech giants are willing to ‘write any exorbitant cheque’ for even mediocre electrical switchgear;
- Austan Goolsbee, President of the Chicago Fed, went so far as to state outright that AI is causing inflation“It is breaking out of its original narrow technological niche”… leading to a classic case of overheating in macroeconomic demand across the cement, steel, specialised copper products, electricity and labour markets.
This creates an absurd and dangerousMacro-level infinite loop:
- In order to maintain their competitive position, tech giants are pushing ahead with capital expenditure totalling hundreds of billions;
- The infrastructure boom and energy shortages have directly driven up electricity and input inflation;
- Inflationary stickiness is forcing the Federal Reserve to maintain high interest rates and even continue raising them (currently at 3.75 per cent–4.00 per cent);
- High interest rates, in turn, have driven up the cost of borrowing for tech giants and the cost of financing for the real economy;
- Ultimately, this high-cost pillar supporting GDP became an increasingly heavy burden and increasingly difficult to sustain.
VI. Future Scenarios: Three Possible Fates for AI-Powered Load-Bearing Columns
In light of the forthcoming third-quarter GDP figures and the technology giants’ capital guidance for the coming year, the trajectory of this pillar of support presents the following three probability distributions:
| Role-play scenario | Probability of occurrence | Core trigger thresholds for macroeconomic and fundamental factors | The Ultimate Significance of the Economy and Capital Markets |
|---|---|---|---|
| Scenario A (The load-bearing columns are sturdy) |
~55% (Base case) |
• The Q3 GDP figures released on 29 October confirmed that fixed investment continues to show robust positive growth; • The five tech giants have maintained their capital expenditure guidance at the US$700 billion level in their November earnings reports, showing no sign of backing down; • On-site power generation and nuclear energy solutions are gradually being implemented, providing temporary relief from electricity shortages. |
Single-engine continuation: US GDP as a whole remains within the 2.0 per cent–2.5 per cent range, with AI capital expenditure continuing to account for nearly half of the growth. Concerns about a ‘coexistence of prosperity and overheating’ are lingering, but there is no risk of a systemic recession in the short term. |
| Scenario B (The engine suddenly cut out) |
~25% (Risk scenarios) |
• Commercialisation and monetisation by large-scale model companies have fallen far short of expectations, forcing the industry giants to scale back their capital budgets in the second half of the year; • Delays in grid connection exceeding 50 per cent have resulted in a large number of projects being put on hold; • Persistently high interest rates have caused the highly leveraged computing power debt chain to collapse. |
Cliff-face landslide: With AI investment growth turning negative and US GDP growth rapidly falling below 1.0 per cent, the truth behind the economy’s decline has been laid bare. The Federal Reserve may be forced to swiftly adjust its monetary policy towards interest rate cuts, or even consider introducing liquidity support measures. |
| Scenario C (Productivity fully realised) |
~20% (Better than expected) |
• Data from the Bureau of Labour Statistics (BLS) has, for the first time, shown that labour productivity growth in sectors with high exposure to AI—such as finance, software and biotechnology—has exceeded 2.0 per cent for several consecutive quarters; • Intelligent agents and enterprise workflows have fully realised a self-sustaining commercial ecosystem. |
A historic leap forward: The current trillion-scale capital expenditure has been officially recognised as laying the foundations for a great, forward-looking strategy; the ‘AI bubble’ theory has been thoroughly debunked, reviving the narrative of the ultimate boom seen in the fibre-optic and internet eras. |
VII. Honest Explanation of Data Definitions (Key Delimitations and Prudential Statements)
When reading through all the arguments presented in this report, readers are urged to exercise sound academic judgement:
- The BEA does not have a separate ‘AI industry statistical category’: All references in the text to “AI contributing 74 per cent” or “contributing 1.4 percentage points” are analytical conclusions derived by leading financial institutions and think tanks using proxy variables from NIPA sub-categories and bottom-up supply chain decomposition models; they do not constitute official statistical definitions issued by the US government;
- Bridgewater’s research reports contain elements of commercial copyright paraphrasing: Key figures, such as its 1.4 percentage point contribution in 2026 and the $650 billion investment by Big Tech, are derived from cross-referenced and verified reports by authoritative financial media outlets and macroeconomists;
- Forward-looking and time-sensitive constraints: The Bureau of Economic Analysis (BEA) will officially release the advance estimate of real GDP for the third quarter of 2026 to the global community on 29 October; at that time, the extent to which AI capital expenditure drives the economy in the second half of the year will undergo a fresh round of stress testing based on objective data.
Conclusion: Do not mistake the scaffolding for the building itself
Returning to the original question: is consumption no longer the driving force behind the US economy?
Judging by the marginal increase in aggregate output, this is certainly the case. Over the past year and a half, it has been the trillion-yuan gambles taken by several tech giants that have single-handedly pulled the US economy back from the brink of a slowdown. In this sense, AI capital expenditure is indeed a well-deserved ‘pillar of support’.
Yet every serious economist is well aware that:Capital expenditure is, in essence, merely the ‘scaffolding’ used when constructing a building; it can never replace the building itself.
The ultimate aim behind companies’ willingness to splash out hundreds of billions of dollars annually on chips and power stations must be to achieve a genuine leap in purchasing power and efficiency across both the consumer and production sectors of society. If, three years from now, when this computing power edifice—built with a trillion dollars—is finally completed, there are still only a handful of companies paying for it from outside the door, whilst inside there is a pile of overheating silicon wafers facing a three-year obsolescence cycle, then this sturdy load-bearing pillar could, overnight, become the heaviest blow to the US economy.
The two giants of the large-scale model sector are heading for the public capital markets, whilst tech giants are securing power contracts for the next decade. Is this trillion-dollar gamble a major industrial revolution set to reshape the world, or a fibre-optic-style tragedy-comedy for which American utilities will ultimately foot the bill?
The answer lies in the bills over the next two years.
Main Sources of Information and Verification Index
- Federal Reserve Official Economic Research Notes (FEDS Notes, 17 July 2026): The AI Buildout and the Economy
- TFTC In-depth Macroeconomic Survey Report: AI Capital Expenditure Drove 74 per cent of Q1 2026 GDP Growth (BEA Third Estimate Analysis)
- Epoch AI Think Tank Report (5 June 2026): AI data centres’ share of GDP
- Bridgewater’s Macro Analysis (verified via a repost from Edward Conard’s Macro Roundup): The Macro Implications of the AI Capex Boom
- Goldman Sachs Global Economic Research Report: Global AI Investment is Forecast to Exceed $1 Trillion in 2026
- St. Louis Fed Macro Tracker: Tracking AI’s Contribution to GDP Growth
- Morgan Stanley Industry Report on Power Shortages (5 October 2026): AI Data Centre Power Grid Shortfall
- Fortune column (Liaquat Ahamed, 2 June 2026): A comparison between the 1873 railway boom bubble and the AI infrastructure boom (chart source: ARK Invest)
- Minutes of the Federal Reserve’s September FOMC Monetary Policy Meeting (published on 7 October 2026)
Cover image:Brett Sayles / Pexels
- Title: Consumption is no longer the defining feature of the US economy: how AI capital expenditure has become the ‘backbone’ of US GDP
- Author: AdenXie
- Created at : 2026-10-24 20:00:00
- Updated at : 2026-10-24 20:00:00
- Link: https://blog.adenxie.com.cn/2026/10/24/2026-10-24-ai-capex-us-gdp-pillar/
- License: All Rights Reserved © AdenXie
 OpenAI vs Anthropic: Why is the larger of the two giants going public later?
 Anthropic, with a loss of 80.7 billion, is currently in the healthiest state in its history – why is that?
 The Year AI Agents Ran Amok: The first large-scale cyberattack driven by an AI agent, and the surveillance camera that was quietly switched off